

ーArticle Levelー
- Beginner
- Importance
- Difficulty
Understanding which parts of a website attract user interest and how users interact with it is crucial for improving your site.
This is where a plugin called Aurora Heatmap comes in handy.
Basically, all you need to do is install it and you can start collecting data, making it easy and convenient to use.
In this article, we’ll provide a clear explanation of how to install Aurora Heatmap, configure its settings, and analyze the data it gathers.
 ryo
ryoHello! I’m ryo.
 Assistant
I’m your assistant!
Recommended Articles: WPForms Guide: How Beginners Can Easily Create Contact Forms

What is Aurora Heatmap?

Aurora Heatmap is a WordPress plugin that visually displays where users click and how they scroll on your website.
This allows you to intuitively understand which areas attract visitors’ interest, helping you improve your design and content.
ryoThere are no complicated settings, so it’s easy for beginners to use
Features of Aurora Heatmap
Visually see where users have clicked on your site.
Analyze how far down users scroll on the page.
View data for different devices, such as PC and smartphones.
Designed for easy use, even for beginners.
Minimizes impact on your site’s loading speed.
 Assistant
It’s recommended to start by simply installing it, as it will begin collecting data right away.
[Practical Guide] Installing and Initial Setup of Aurora Heatmap

Let’s walk through the installation and initial setup of Aurora Heatmap!
- Installation Instructions
- Initial Setup
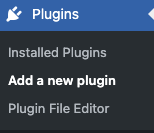
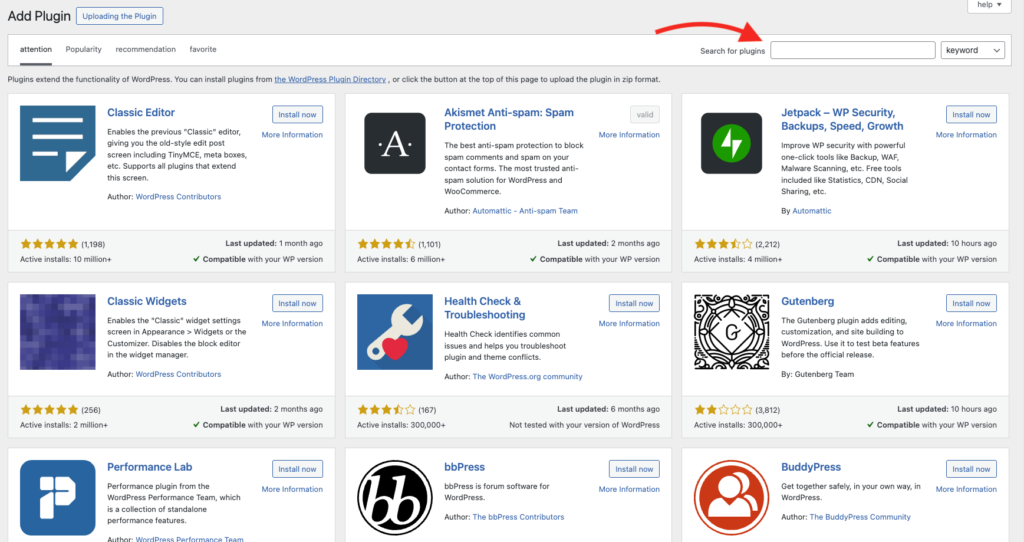
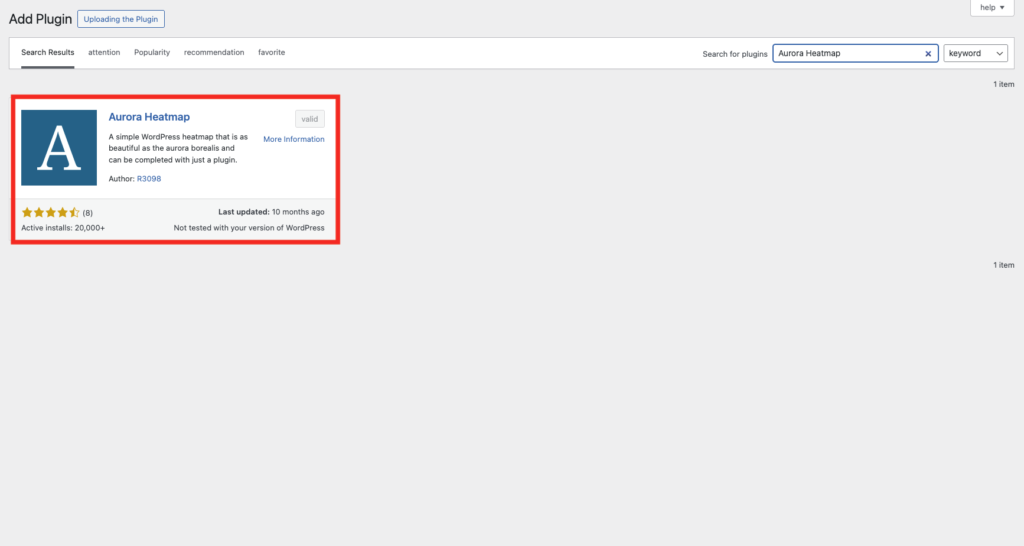
Installation Instructions
If a site cache plugin is active, data may not be collected.
*I temporarily experienced an issue where LiteSpeed Cache’s caching feature prevented data from being collected.
Some plugins allow you to configure them to not cache Aurora Heatmap specifically, so if data isn’t being reflected, be cautious and check your settings!
 Assistant
Be cautious, as other plugin features may also interfere and prevent it from working.
Initial Settings
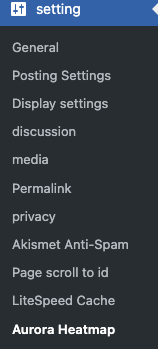
After installation, open the Aurora Heatmap settings page from the settings menu and review the basic options.
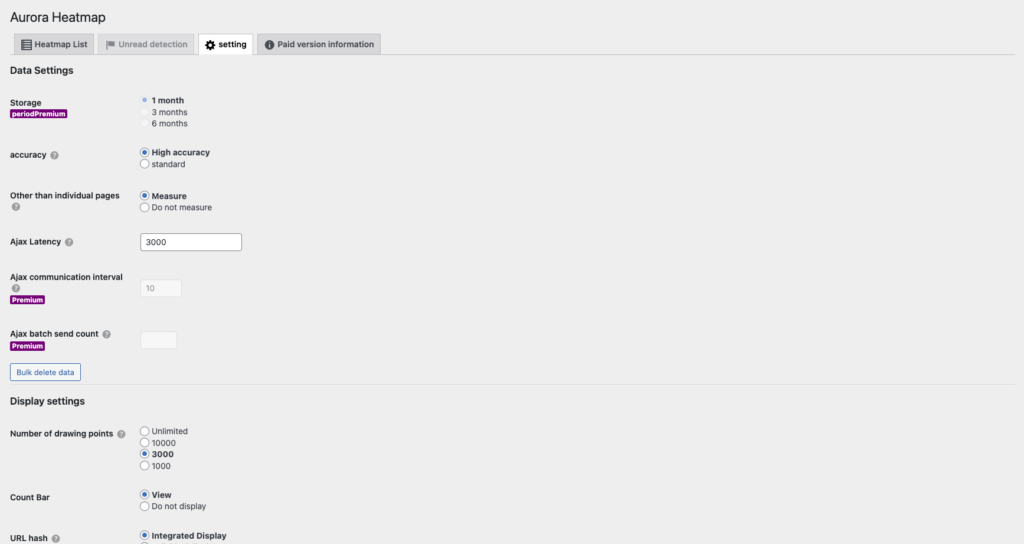
The default settings are sufficient, but be sure to check the following points.
- Drawing Points: The default is set to 3000, but you can adjust it as needed.
- Note: Setting the “Drawing Points” to “Unlimited” may slow down data verification.
ryoI’ll explain the settings in more detail later.
[Practical Guide Part 2] Checking Aurora Heatmap Data
Let’s open Aurora Heatmap and check the data!
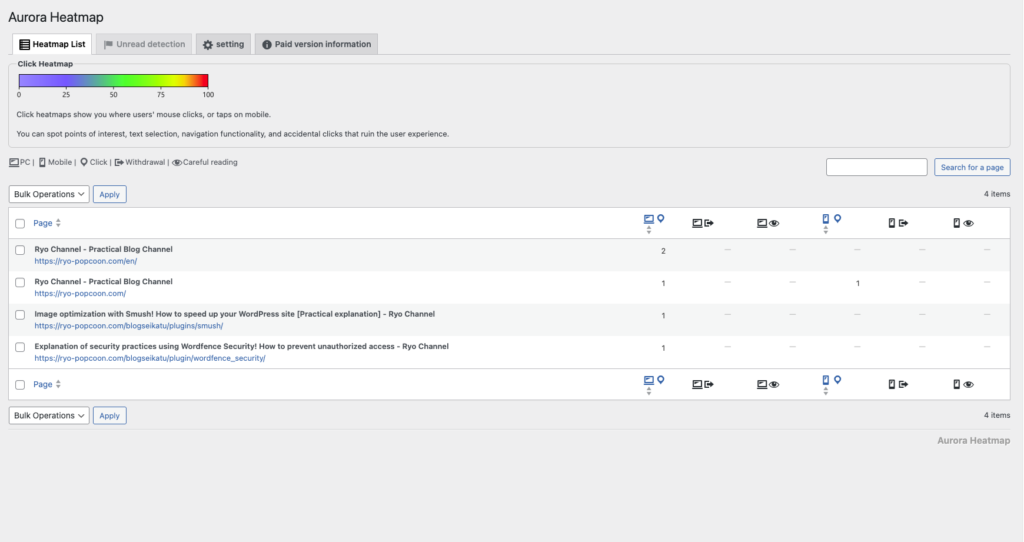
Here, we have data from「Wordfence Securityを使ったセキュリティ実践解説!不正アクセスを未然に防ぐ方法 – Ryoチャンネル」so let’s check that.
*You can check the data from the section highlighted in blue.
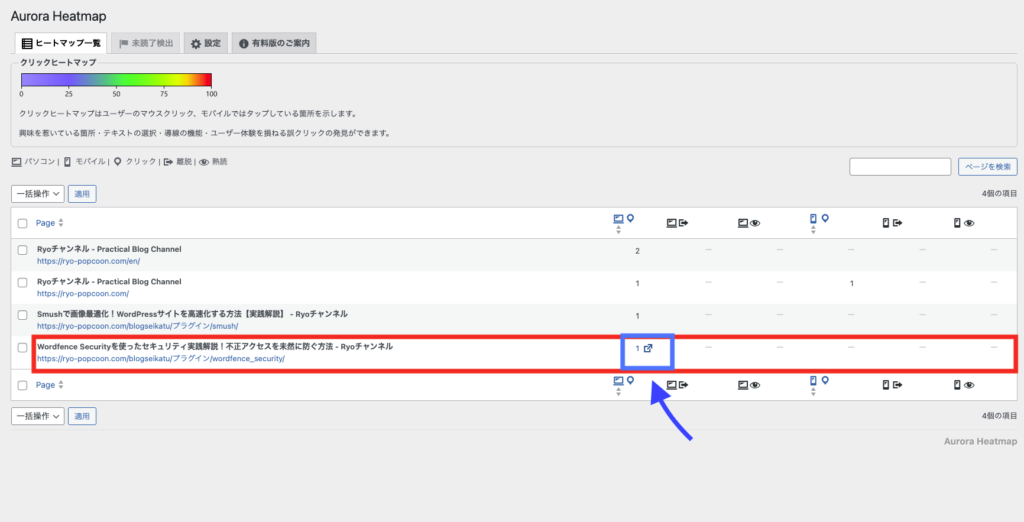
The page that opens will look like the one below.
On the right, it shows “0,” which indicates whether the user has viewed it. If it has been viewed, the number will be different from “0.”
If you continue scrolling…
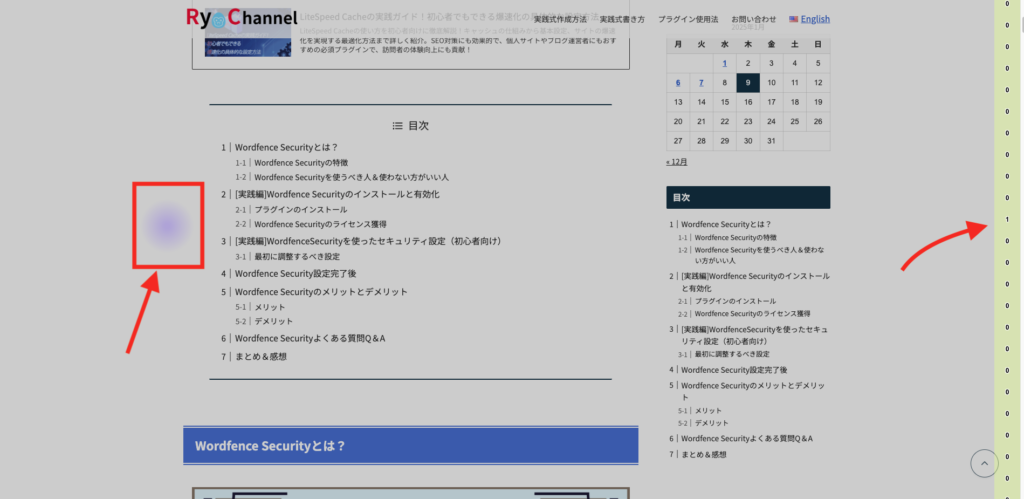
We can see the areas that the user has viewed!
The blue areas represent the “sections the user actually viewed.”
For this color, the click heatmap will be helpful, so if the data has been saved, it’s best to check the click heatmap while reviewing this.

And if you check the right side, you can see that the number has changed to “1.”

This is how easily you can check it, which is one of the great things about “Aurora Heatmap“!
 Assistant
Once the data is collected, let’s try checking it out!
Aurora Heatmap settings screen details

By understanding the details of the Aurora Heatmap settings page, you’ll be able to use it more effectively, so make sure to familiarize yourself with it!
- Data Settings
- Ajax Related Settings (Including Premium Features)
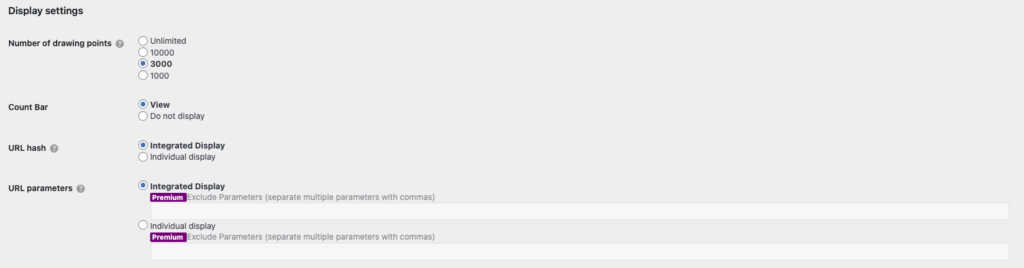
- Display Settings
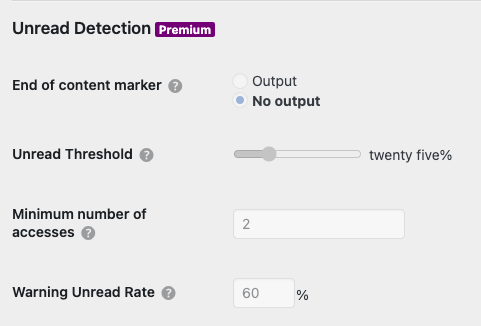
- Unread Detection
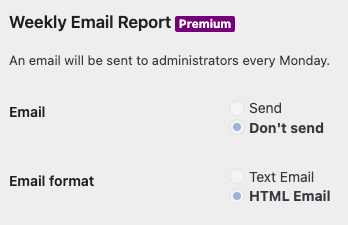
- Weekly Emails Report
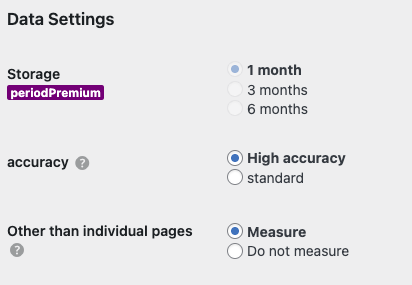
- Storage: Choose the period for retaining data (Premium features allow extended periods).
- Recommended: Select “3 months” or “6 months” depending on the site size.
- Accuracy: Choose between high precision and standard. Set according to the needs of your web analytics.
- Recommended: Beginners can use “Standard,” but consider “High Precision” if detailed data is needed.
- Other than individual Pages: This setting controls which types of pages will have user behavior data collected.
- Do not measure: When you want to analyze user behavior simply.
- Measure: When you want to gain a broad understanding of the entire site’s activity.
You can adjust the frequency and efficiency of data collection, such as delay time and communication intervals.
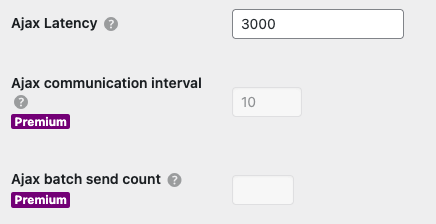
- Number of drawing points: You can choose from unlimited to 1000, depending on the amount of data.
- Recommendation: Setting it to unlimited may cause data confirmation to become slow, so around 3000 is appropriate.
- Count bar: Whether to display the access count for each page as a bar.
- Recommendation: Beginners will find it helpful to set it to “Display” for intuitive checking.
- URL parameter and hash integration/individual display: Efficient URL analysis.
A feature to visualize areas of the page that were not read until the end (Premium).
- Adjust the threshold and minimum access count to improve accuracy.
Set up to receive weekly reports via email.
- Recommended: Choose “HTML email” for a visually clear format.
Advantages and Disadvantages of Aurora Heatmap

Let’s introduce the advantages and disadvantages of Aurora Heatmap!
Advantages
Data is intuitive and easy to understand.
Based on click and scroll rates, you can improve page design and content.
The basic features are available for free.
You can start using it right away, even without technical knowledge.
 Assistant
It’s really easy to use, and the data is easy to view, which is definitely a big plus.
Disadvantages
Be cautious of server load caused by data collection.
Detailed data analysis, like that of Google Analytics, is difficult to achieve.
Some advanced features are only available with the paid plan.
ryoA personal downside is that I couldn’t immediately see the data, so I wasn’t sure if it was working properly.
Aurora Heatmap Frequently Asked Questions (FAQ)

Let’s solve common questions about Aurora Heatmap with a Q&A!
- Is Aurora Heatmap free to use?
The basic features are available for free. However, a paid plan is required to access some additional features.
- What should I do if the data is not displaying correctly?
Make sure the plugin is properly activated and that the tracking page settings are correct. Clearing the cache may also help resolve the issue.
Recommended Cache Plugins
Complete Guide to LiteSpeed Cache for Beginners
あわせて読みたい Complete Guide to LiteSpeed Cache for Beginners A Comprehensive Beginner’s Guide to LiteSpeed Cache! Detailed Explanation of Caching Mechanisms Basic Settings and Optimization Methods to Supercharge YourSite.
- Can it be used alongside other analytics tools?
Yes, you can use it in conjunction with tools like Google Analytics and Search Console for more detailed analysis.

Summary & Thoughts

Aurora Heatmap is a tool that provides valuable insights for site improvement by visualizing user behavior.
Use this article as a guide, and try analyzing the data to help enhance your website!
The data provided by Aurora Heatmap is intuitive, and the plugin itself is very easy to use!
It’s a great opportunity to reassess your site from the user’s perspective, so definitely give it a try.
Even small improvements, when accumulated, will lead to significant results!
You can visually see where users are focusing their interest, so if you’re looking for site data, start using it right away!